The Question Library Report provides administrators with insights into how questions within the Question Library are being used across Challenges, Courses, and Trackers. This report helps identify which questions are most active, where they appear, and how they contribute to engagement and outcomes.
This report can be used to:
- Analyze aggregated data from all Question Library items.
- Track how specific questions perform over time.
- Support program audits and data quality reviews.
- Identify which areas (e.g., topics or question types) are most actively used.
Report Output
The report provides an aggregate view of Question Library data across the platform. Key visualizations typically include:
Usage and Trends Over Time: Question interactions and responses by month or week.
Question Response Distribution: Breakdown of "response diversity," which indicates patterns in responses and whether particular responses are more typical.
Demographic Insights: Engagement differences across gender and age groups.
How to Run the Report
Go to the Reports section of the admin...
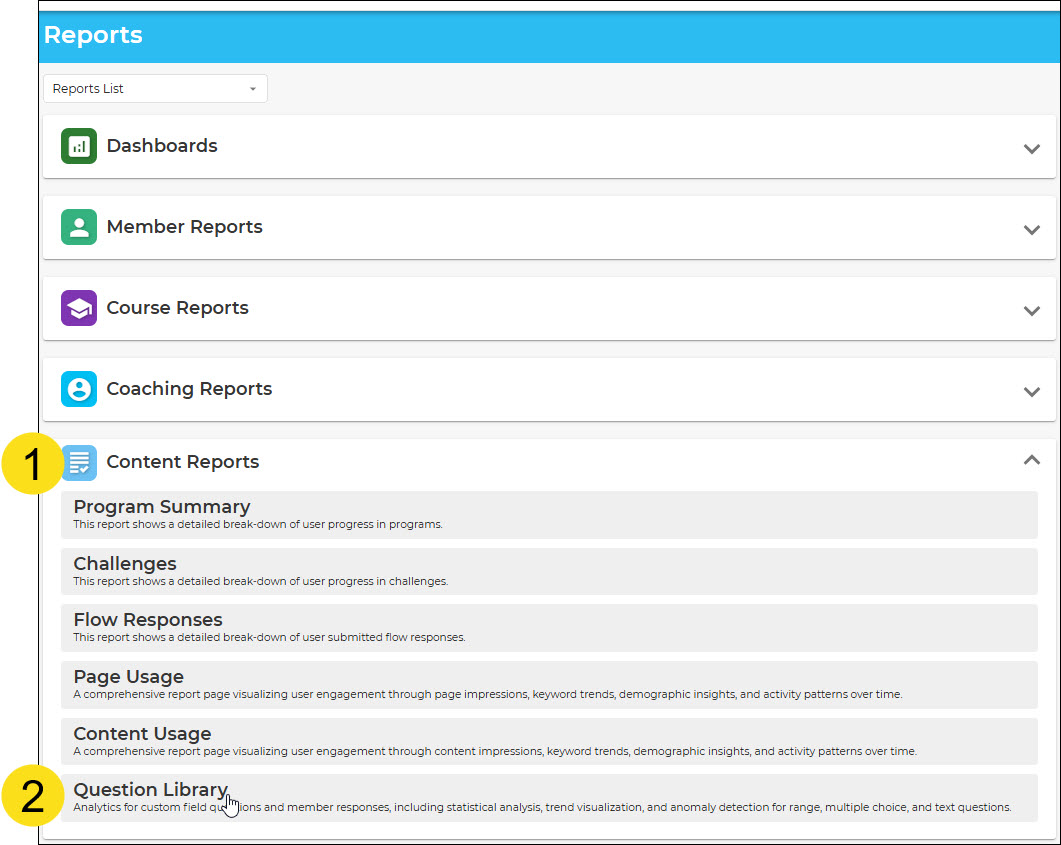
- Click on the Content tile
- Click on Reports
From here, you can choose how to set the filters and time parameters for the reports you want to run.

- Set the date range
- Choose the intervals for which data is charted (by day, week, or month)
- Choose a specific portal and group (optional) or run the report for all portals
- Filter by gender (optional)
- Filter by age range (optional)
- Run the report
Now you can view data for all questions in your question library.

Was this article helpful?
That’s Great!
Thank you for your feedback
Sorry! We couldn't be helpful
Thank you for your feedback
Feedback sent
We appreciate your effort and will try to fix the article